


California Pizza Kitchen (CPK) Thank You Card promotion – where every card is a winner – is still going on through THIS Sunday, April 22! Most importantly, $50,000 in cash is still up for grabs, which means everyone with an unopened Thank You Card needs to head out to their local CPK over the next five days to find the big grand […]


Hooters, the original wing joint, has unveiled a new limited-time offer (LTO) “sizzling menu” running through summer that includes an array of scrumptious new items, from a brand new Mango Habanero wing sauce to shareables like Cheese Curds served with marinara sauce and two new styles of loaded fries. The new Mango Habanero Sauce is […]
Kyuramen, the renowned Japanese ramen chain, introduced its location at 6623 Roswell Rd NE, Sandy Springs, GA 30328 that brings authentic and innovative ramen experiences at an affordable price to Sandy Springs residents. Participating in Kyuramen’s nationwide “New Bowl Lottery Game,” the Sandy Spring location allows diners to have a chance to win a free […]

This 4/20, come to Denny’s for a brew-tiful celebration. In honor of National Cold Brew Day on April 20, Denny’s is pleased to provide Denny’s rewards members 20 percent off one Sweet Cream Cold Brew. Customers must become value members before April 20 to be eligible for this special all-day offer. No matter what holiday you’re celebrating, […]

Fleming’s Prime Steakhouse & Wine Bar is celebrating Moms with amazing 3-Course Menus for Mother’s Day weekend. Fleming’s will be offering a new 3-course Lunch Menu that will be available starting at 11 am on Saturday, May 11, 2024 and 10 am on Sunday, May 12th, 2024, as well as a classic Surf & Turf […]
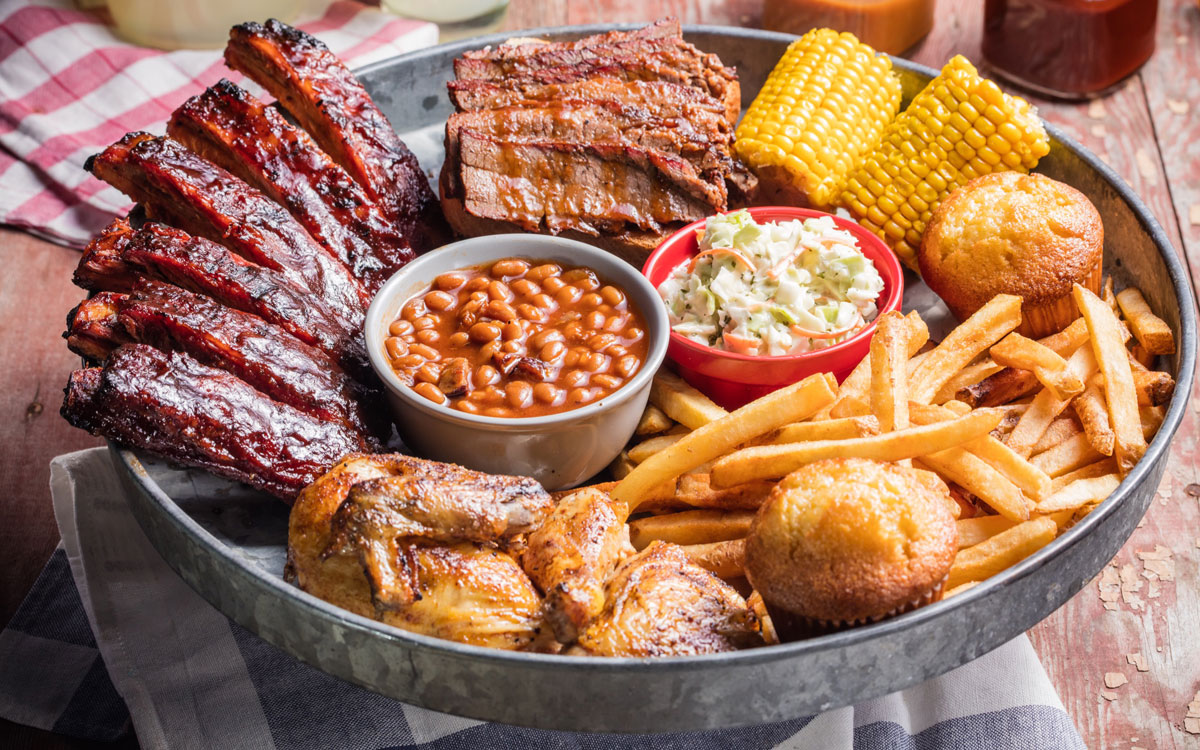
Ponderosa and Bonanza Steakhouses, known for their family-friendly atmosphere and classic cuisine, has rolled out another delicious limited-time special, All You Can Eat Wings. The flavor fest you won’t want to miss features unlimited servings of a variety of fried to perfection chicken wings, including two brand-new sauces. Hurry in soon – the finger-lickin’ deal […]

Five Iron Golf announced the signing of a lease for a new franchise location at 179 North Main Street in Port Chester, NY. Led by seasoned professionals John Cornelius, Jake Dowden, Jeff Kelly, and George Jamgochian, this venture will bring the renowned Five Iron Golf brand to the vibrant Port Chester area of Westchester County. […]
Subscribe to FS Insider
"*" indicates required fields