Diners are emerging from the fog. In the week ending May 30, restaurants posted positive same-store sales for the 11th consecutive period, according to Black Box Intelligence. It was the best run in nearly two months. Even more promising, fine dining proved the top-performing segment for sales. Black Box credited “significant pent-up demand for experience-based dining,” along with graduations. Just the fact people are celebrating with restaurants again is a sigh of relief operators have waited on for what feels like decades.
DoorDash’s Deep Dish report, released Tuesday, showed a rise in celebrations and generosity as well, with 65 percent of Americans saying they were more likely to celebrate birthdays or holidays with family and friends in 2021 compared to 2020.
By mid-May, per data platform Zenreach, foot traffic at food and beverage spots rose 41 percent versus January. Some dips along the way, but an overall steady ascent.


“The Q1 data leaves us very optimistic about consumer foot traffic throughout spring and leading into summer. Retailers should leverage these cues to start planning their ramp-up strategies: whether it’s expanding business hours, re-hiring, or picking up marketing efforts. Barring any unforeseen setbacks, we anticipate that these trends will continue to gain momentum moving forward,” Megan Wintersteen, VP of Marketing at Zenreach, said in an email.
So it’s pretty clear vaccines, time, and simple COVID attrition are beginning to fuel the restaurant recovery. But the ripple question is, what kind of consumer is going to frequent restaurants past the (re)trial period? People will come back because they can, and because they haven’t dined out in a while. And also to exert some control over their social lives after coronavirus stripped our retail independence.
Yet here’s an example of something to consider, as shared recently by PYMNTS and Paytronix in a collaborative report.
In April, food ordering app Seamless introduced a “reverse activation” restaurant on wheels, “Presto! Resto!” to give New Yorkers a dine-in experience they longed for.
Twitter and Instagram users throughout the city shared stories about what they missed most and tagged posts hoping for a chance to get the truck dispatched to their homes. Seamless picked a winner each day, decorated its truck to match the décor of one of four native-New York City eateries, and sent the vehicle to their front door.
This experiment ended by May. However, the connected devices that enabled Presto! Resto! to deliver dine-in experiences remain firmly situated at the core of the restaurant industry.
Aggregator and app-enabled ordering features dominated consumers’ lives over the past year. And despite reopenings and fervent pent-up demand, it’s becoming increasingly clear these channels will remain vital long after people safely return to restaurants.
In the week ending May 30, per Black Box, off-premises were “extremely high,” the company said, but the rate of growth has steadily declined since mid-March. A sign of a changing, reopening landscape.
According to Datassential’s Firefly service, there were 299,564 restaurants open for dine-in services as of June 1. That included 132,525 chain restaurants and 167,039 independents.
Of the chain slice, 52.55 percent were quick-serve; 11.52 percent midscale dining brands; 1.52 percent fine dining; 13.51 percent fast casual; and 20.73 percent casual dining.
For independents, the figures were 15.22 percent; 27.79 percent; 2.06 percent; 5.63 percent; and 48.97 percent, respectively.
To understand what’s at stake moving forward, it’s important to line up the COVID crisis with the Great Recession. There’s a major difference that flashes.
In 2008, the financial system collapsed, which caused significant (and sometimes catastrophic) disruptions to businesses and consumers alike. That wasn’t necessarily the case in 2020, says Andrew W. Lapin, a partner with Robbins, Salomon & Patt, LTD.
“To the contrary,” he explains.
“Financial institutions were much stronger going into 2020 than 2008, partly as a result of legislation that was enacted after 2008 forcing financial institutions to carry more reserves and take other conservative measures to ensure they would not collapse in a future calamity,” Lapin adds.
In 2020, though, governments created instant and substantial liquidity to their economies. At the same time, they doled out money to support consumers (stimulus).
“As a result, consumers have substantial accumulated wealth and have decreased their debt. Add in the pent-up demand of having nothing much to do or spend on over the past year and the result is a booming economy,” Lapin said.
There are occasions—and money—to go around. While the sudden novelty of dining in is, undoubtedly, going to tug hordes of consumers back into restaurants, it isn’t going to cripple more than a year’s worth of takeout and delivery habits. Customers will have a chance to access both channels (off-premises and dine-in). And if anything, the loyal dine-in user has added the off-premises experience to their restaurant checklist.
They had no choice but to get Olive Garden for takeout in March 2020. Did they even consider that option before COVID? If the answer was no, you can bank there are a lot more “yes” responses today. The pandemic, for its ample list of negatives, did wonders for off-premises awareness.
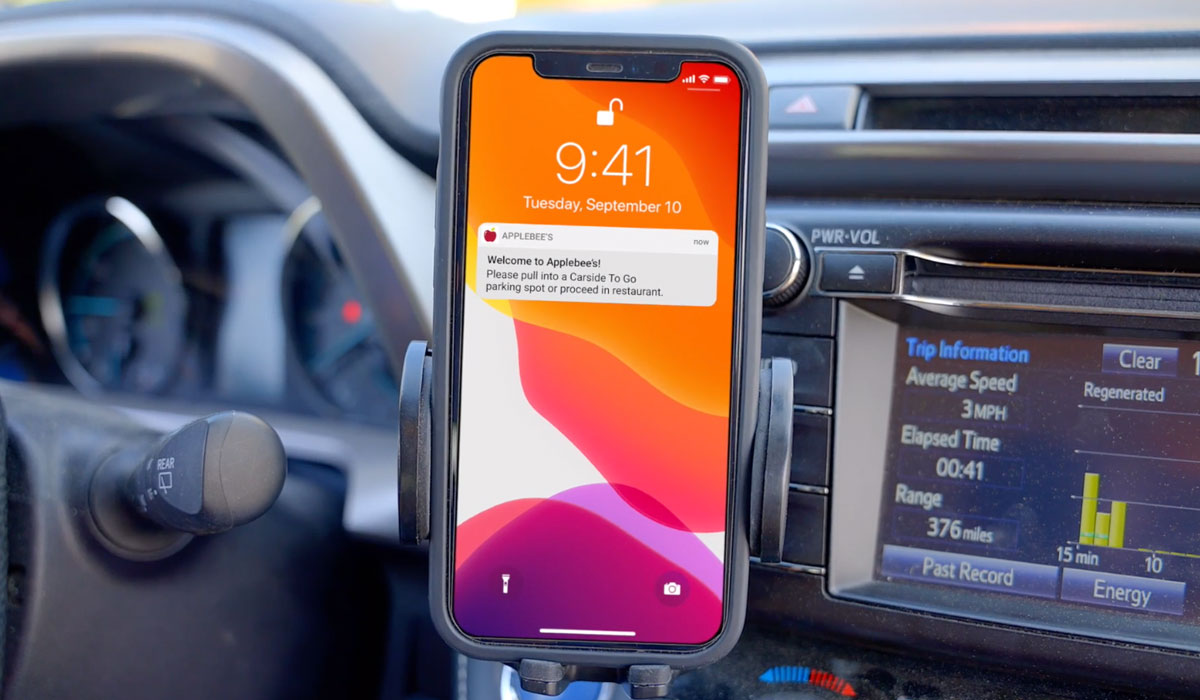
Applebee’s and IHOP, for instance, while speaking frequently about the “Restaurant Renaissance” and how dine-in will feed recovery, also just partnered with Flybuy Pickup to improve carside and in-restaurant pickup, and delivery. This well after the COVID trough.
Flybuy’s tech proved in tests to reduce guest and driver wait times, maintain food freshness, and also remove friction in the pickup process for guests and employees.
Flybuy integrates directly into Applebee’s and IHOP’s mobile and online ordering experiences. Guests place an order and drive over. End of steps. The restaurant then receives guest or delivery driver location updates and estimated time of arrival. Orders are fulfilled and prioritized based on the party’s arrival time.
With all of this in mind, the reality is we’re now in a “connected economy.” That doesn’t mean, however, so-called “connected consumers” can be treated as broadly as marketers once viewed millennials. These guests own different devices. They order food in different ways.
Consumers who own only smartphones, Paytronix and PYMNTS said, often possess very different age, income, and educational backgrounds than those who own smartphones, voice-activated speakers, connected cards, and wearables, for example.
Individuals’ ordering needs and expectations are as diverse as the consumers themselves.
The question then surfaces, “what can consumers’ connected-device collections reveal about their appetite for digital food ordering experiences, and which features must cafes, diners, quick-serves, and full-serves provide to drive restaurant spend among these digitally savvy guests?”
Groups to follow
Paytronix and PYMNTS segmented consumers into five categories based on how many connected devices they regularly use. Use this as a map key of sorts.
Superconnected
Average age: 46
Share earning more than $100K in annual income: 48 percent
Share with a bachelor’s degree: 41 percent
With six or more connected devices, superconnected users are the highest earners and the biggest restaurant spenders. The average superconnected restaurant customer spent 26 percent more on food orders than average in the last 12 months.
Connected Me
Average age: 43
Share earning more than $100K in annual income: 39 percent
Share with a bachelor’s degree: 40 percent
Ninety percent of this group plans to keep ordering online at least somewhat as often as they do now after the risk of contagion has passed. They have fewer than six devices including connected wearables.
Connected Home
Average age: 50
Share earning more than $100K in annual income: 34 percent
Share with a bachelor’s degree: 31 percent
Also with fewer than six devices, this group is defined by such items as voice assistants or other smart appliances. Fifteen percent report ordering less in person and more online for at least one restaurant.
Mainstream Mobile
Average age: 53
Share earning more than $100K in annual income: 26 percent
Share with a bachelor’s degree: 31 percent
Forty percent of these users say they will go back to dining on-site just as much as they did before March 2020 once it is safe to do so. They also rely on just tablets and smartphones.
Smartphone Centric
Average age: 45
Share earning more than $100K in annual income: 14 percent
Share with a bachelor’s degree: 20 percent
With only a smartphone as a connection point, these users aren’t changing their habits. One hundred percent of them plan to keep ordering online at least somewhat as often as they do now.
“This survey shows clearly that restaurants must enable guests to order regardless of their device of choice, whether that’s phone, tablet, TV, Alexa, Car Dashboard. All of that is now key to offering a unique guest experience,” Michelle Tempesta, head of marketing for Paytronix Systems, Inc., said in an email. “Guests expect technology to use their previous ordering history to make the current order experience even easier, just as they appreciate an on-premises server recognizing a frequent customer and knowing their favorites. New technology presents personalized recommendations, complementary menu items that fit dietary preferences, and make the guest feel confident they will receive what they love when the delivery bag arrives.”

With Flybuy, Applebee’s and IHOP can see how far away guests are, and fulfill orders in response.
The differences, why it matters
Nearly twice as many superconnected consumers shifted to ordering online over the past year compared to other groups, meaning digital capabilities will be critical to capturing these highly connected consumers’ future restaurant spend.
This is sensible considering anybody with six-plus devices probably has a strong appetite for digital commerce. They also shop retail online. Grocery. Etc.
This potential guest was the most likely, by far, to say they’ve ordered less in person, and more online, since the pandemic’s onset. For example, 27 percent made the digital shift when ordering from at least one restaurant. The second-most likely group (connected home consumers) chimed in at 15 percent. Superconnected consumers’ propensity to order online using any of several connected devices at any given time means restaurants need to provide ordering options on many different channels to win their business, the report said.
How many consumers have made the shift to ordering online since COVID?
Smartphone-centric
- At least one restaurant: 7.6 percent
- Table-service: 5.6 percent
- Quick-serves: 10.7 percent
Mainstream mobile
- At least one restaurant: 6.1 percent
- Table-service: 6.4 percent
- Quick-serves: 4.4 percent
Connected home
- At least one restaurant: 14.5 percent
- Table-service: 13.5 percent
- Quick-serves: 11.3 percent
Connected me
- At least one restaurant: 12.6 percent
- Table-service: 9.9 percent
- Quick-serves: 9.9 percent
Superconnected
- At least one restaurant: 26.8 percent
- Table-service: 22.3 percent
- Quick-serves: 22.8 percent
To put it plainly, omnichannel engagement will serve as a critical lever to capture the spend of multiple groups. There may be fewer smartphone-centric and connect me consumers who have shifted to ordering online, the report said, but the people who have are more likely than others to keep doing so long into the future. Ninety percent of connected me digital shifters said they plan to keep ordering online at least somewhat as often as they do now after the risk of contagion passes. Smartphone-centric digital shifters took it a step further, as 100 percent said they expect to keep ordering online at least somewhat as often as they do now.
How many consumers will stick to ordering online after the pandemic has subsided?
Smartphone-centric
- Maintain all: 36 percent
- Maintain some: 64 percent
- Revert: 0 percent
Mainstream mobile
- Maintain all: 24.1 percent
- Maintain some: 35.6 percent
- Revert: 40.3 percent
Connected home
- Maintain all: 36.7 percent
- Maintain some: 50.4 percent
- Revert: 12.9 percent
Connected me
- Maintain all: 26.4 percent
- Maintain some: 63.3 percent
- Revert: 10.2 percent
Superconnected
- Maintain all: 26 percent
- Maintain some: 60.7 percent
- Revert: 13.3 percent
The mainstream mobile consumers appear superconnected’s opposite. They were the most likely category to plan to return to old dining habits. Forty percent said they’d go back to dining on-site just as much as they did before (once it’s safe to do so). This is more than three times the share of superconnected consumers who plan to do so.
Yet the data doesn’t suggest consumers expect to stop ordering online, the report said. Even among mainstream mobile shifters, the strong majority intend to keep ordering online at least somewhat as often as they do now in a safer future.
It goes back to the earlier point. In COVID’s wake, there will be digital-obsessed customers who never look back—people who were almost surely headed that way regardless of the pandemic’s forced acceleration.
And then there are those who expect to jump back into restaurants. Where the opportunity lies is in understanding that latter guest isn’t exclusive to one or the other. They will carry pandemic ordering habits forward (digital), yet also return to sit-down occasions. You can win them over twice.
More on the superconnected
These users are the highest earners and biggest restaurant spenders, per the report. The average superconnected restaurant customer spent 26 percent more on food orders than average in the last 12 months.
This group’s penchant for transacting online reflected in their food spend, which was higher on food ordered online than on food ordered either in person or over the phone.
The average superconnected restaurant customer spent $2,424 on online table-service restaurant orders and $2,431 on online quick-service restaurant orders during the past 12 months. This compared to an average of $1,977 and $2,200, respectively.
Superconnected restaurant goers’ online spend also eclipsed the rest of the pack, although connected me consumers and smartphone-centric users were close behind.
The average connect me guest spent $2,348 on online orders at sit-down brands, and the average smartphone-centric consumer forked up $2,411.
Broken down (how much consumers spent on food orders in the past year):
Phone
Quick-service
- Smartphone-centric: $1,431
- Mainstream mobile: $670
- Connected home: $1,540
- Connected me: $1,343
- Superconnected: $2,200
Table-service
- Smartphone-centric: $833
- Mainstream mobile: $919
- Connected home: $1,455
- Connected me: $1,638
- Superconnected: $1,699
Online
Quick-service
- Smartphone-centric: $2,411
- Mainstream mobile: $578
- Connected home: $1,924
- Connected me: $2,290
- Superconnected: $2,431
Table-service
- Smartphone-centric: $1,519
- Mainstream mobile: $1,100
- Connected home: $2,062
- Connected me: $2,348
- Superconnected: $2,424
Dine-in
Quick-service
- Smartphone-centric: $2,259
- Mainstream mobile: $709
- Connected home: $1,065
- Connected me: $1,156
- Superconnected: $2,006
Table-service
- Smartphone-centric: $899
- Mainstream mobile: $1,499
- Connected home: $1,715
- Connected me: $1,750
- Superconnected: $1,997
Loyalty speaks
Connected me consumers in the study reported using more loyalty programs than the rest. Two-thirds said they deploy at least one restaurant’s program.
Customers were more likely to use loyalty platforms when they owned a wider variety of connected devices on which to place those orders.
How many consumers in different connected personal groups use loyalty programs?
Smartphone-centric
- At least one restaurant: 21.8 percent
- Table-service: 15.2 percent
- Quick-service: 22.3 percent
Mainstream mobile
- At least one restaurant: 24.9 percent
- Table-service: 22.8 percent
- Quick-service: 17.8 percent
Connected home
- At least one restaurant: 45.6 percent
- Table-service: 38.9 percent
- Quick-service: 33.9 percent
Connected me
- At least one restaurant: 66.4 percent
- Table-service: 55.4 percent
- Quick-service: 51.7 percent
Superconnected
- At least one restaurant: 55.4 percent
- Table-service: 47.8 percent
- Quick-service: 47.6 percent
These three connected persona groups own and use a broader variety of connected devices—including voice-activated speakers, wearables, and other smart appliances—than either mainstream mobile or smartphone-centric consumers, whose devices are limited to desktop and laptop computers, tablets, and smartphones, the report said. Only 25 percent of mainstream mobile and 22 percent of smartphone-centric consumers use at least one restaurant’s loyalty program.
Nevertheless, smartphone-centric consumers stood out as the lone group more likely to use quick-service loyalty programs than full-service ones. Twenty-two versus 15 percent. “The numerous ways in which different connected persona groups engage with their restaurants’ loyalty programs signal that it will not be enough for restaurants to give their customers the ability to order their food on different channels going forward,” the report noted. “They must also ensure that their customers can earn loyalty and rewards benefits on as many channels as they can place their orders if they hope to meet consumers’ demands for omnichannel ordering experiences.”
Loyalty programs proved the most in-demand ordering feature among connected me, mainstream mobile, and smartphone-centric users.
The bottom-line point—operators need to deliver an omnichannel ordering and loyalty engagement experience.
How can you attract these guests and encourage more spend? Follow the numbers in the chart below.

In all, the takeaway is that consumers have vastly different needs and expectations when it comes to ordering food online, just like they do in-store.
And even among consumers who show a preference for returning to dining rooms, digital ordering remains on the rise. Operators can respond by opening accessibility to digital payment and loyalty features, and ensuring customers—no matter their meal of choice—can find a consistent and satisfying experience throughout.